


Modern tools allow you to build and launch new software applications within days if not hours. But what does it take to make sure your system remains stable once it’s released?
In this article, I’m going to teach you the things you should do to make sure you’ll be able to detect and respond to production issues. I’ll walk you through two important ways to add these capabilities to your application, and show you how to use these techniques in a practical example. That and more in this video.
Application Downtime In Modern Applications
Modern internet users don’t tolerate down time. We expect our applications to be up and running 24/7 without interruption. When popular websites fail to meet this promise, they’re all over the news.
For example, in 2019 Facebook was down for over 24 hours, leading to millions of upset customers and a substantial loss in revenue.
This is an example of a big failure that caught global attention. But for every large event, there are dozens if not hundreds of smaller events that silently go under the radar. Issues that cause a problem, but it gets addressed so fast that only a small fraction of users are ever affected.
But how do companies prevent these issues from snowballing into much larger events? It all has to do with proper monitoring and traceability.
When operating a service. There are two broad categories to be concerned with. Being able to detect an issue, and being able to solve an issue.
Let’s start with looking at detection, sometimes also called monitoring.
Detection and Monitoring
Metrics
To detect an issue, you first need to collect metrics on your system’s behaviour. When using something like AWS, a LOT of metrics come for free.
For example, when using a service like EC2, you automatically get access to metrics like CPU utilization, memory usage, disk space, and more. These metrics are critical in assessing whether or not your system is at risk of failing. For example, if you’re hosting your application using EC2, you’ll definitely want to keep an eye on the level of your CPU utilization since persistently high levels can cause application in-stability.
These are a couple different metrics we collect that belong to the infrastructure health category. But there’s many different types of metrics we can monitor for different purposes. For example, a business metric could be a metric on the number of users enrolling in your application per day. An uncharacteristic dip in this metric may indicate a problem that you wouldn’t necessarily see if you were just monitoring system health metrics.
One thing to keep in mind is that metrics that make sense for one system may be useless for another. So It’s important to think about which key metrics are important for your type of application and business.
So now you’ve come up with a bunch of metrics, what do you do with them?
Our next step is to make them highly visible and easy to find.
Dashboarding
Many teams use an application dashboard to display the health of their system at any one time. Dashboards let us collect, categorize, and visualize any number of metrics in one single spot.
The idea is to give the reader the ability to identify issues by looking for anomalies or uncharacteristic behaviour.
Tools like Dashboards are absolutely critical in ensuring you have visibility into your system’s behaviour. If you haven’t already, I suggest watching my video on creating an AWS dashboard to learn more. If you’re brand new to Cloudwatch and looking for a good start guide, check out my video here.
So we’ve identified important metrics, collected them, and put them on a dashboard. But you might be wondering, doesn’t this only work if someone is LOOKING at the dashboard in the first place? And you’d be right.
Alarms
To have a truly robust system, you need to add alarms on your metrics.
Alarms help you get notified of system issues by automatically notifying you via email, page, or other ways. The idea is that the user creates alarms based on existing application trends. You identify what is normal behaviour, and create an alarm on a value that would be considered abnormal. If the abnormal scenario occurs, the alarm will fire. If you’ve never created an alarm before in AWS, check out my article here to create an alarm that triggers an e-mail notification.
Lets understand this more by taking a look at an example.
Assume for a moment we have a metric that tracks the error rate of our application. The normal behaviour of this metric is for it to be at zero or very close to zero at all times.
For this type of scenario, we would want an alarm based on the error rate of this metric. If as a percentage the error rate ever exceeds 1%, then trigger the alarm. When it returns back to below 1% the alarm will move back to normal state.
The exact percentage you select is dependent on your particular application’s behaviour and your tolerance for false positives. If you choose a really high threshold value like 10%, you may never get notified of smaller issues since it would require a really large system failure to make the alarm fire. If you choose something too low like .25%, your alarms will fire constantly and usually be due to some short term, inactionable issue. The key is finding the right balance, and the right value depends on your specific application.
Using metrics, dashboards and alarms, you now have an easy way to detect, visualize, and get notified of potential system health issues.
But what happens when you do run into an inevitable system issue? What tools do you need to identify the root cause? One way is to add traceability to your application.
Traceability
Traceability in this context means to add ways to determine the flow of our application’s execution. One common way is by adding informative and useful logging.
Logging
We use logging to identify the flow of control in our program, and any critical decision points that it may cross.
Logs help us understand what our application was doing based on a certain input. This is critical information to help us identify unpredictable edge cases that may lead to bugs or unpredictable behaviours in our system.
If you haven’t already, you’ll want to add proper logging to your application.
There’s many common logging libraries out there that let you add logs at different visibility levels such as TRACE, INFO, DEBUG, ERROR, and more. This allows you to quickly filter for different log levels to see all errors for example.
Depending on the language you use, the logging library may be different – so make sure you look into which library is appropriate for your specific programming language.
Another popular way to add traceability in the context of AWS is using a distributed tracing system called X-Ray.
X-Ray Tracing
X-Ray tracing is a powerful way to understand the behaviour of your system including what dependencies it calls, how long those calls take, and any errors your program runs into along the way.
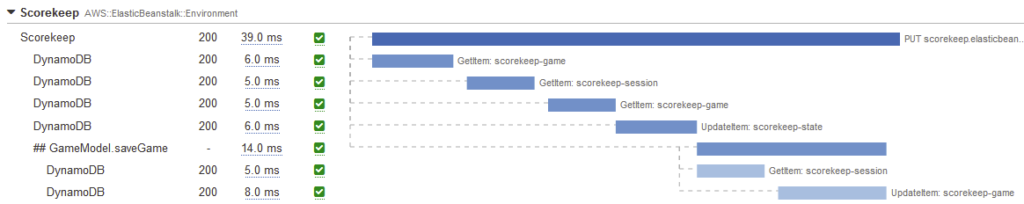
Here’s an example of what a trace looks like for a service that interacts with DynamoDB. We can see each call we make to the service, the table and API we’re using, and how long those requests take. If there were any errors or throttles encountered along the way, we would see them here.
This kind of information is extremely useful for finding unexpected system bottlenecks and slow performing queries. Having things like Xray in our toolkit makes it even easier to root cause most system issues.
So to recap, we’ve learned about several monitoring and traceability techniques. In monitoring, we outlined the need for metrics, alarms and dashboarding. In Traceability, we learned about the need for logging and tracing. To show how these concepts can be tied together in real life, consider the following system failure example.
Bringing it all together with a system failure scenario
An alarm goes off and sends you a text message that your system’s error rate is elevated.
You immediately sign on and take a look at your system’s dashboard to understand where the error can be coming from.
You notice one of your APIs is throwing exceptions. After drilling down into the dependencies section of your dashboard, you see the errors seem to be coming from your database layer.
To determine the culprit of the error, you first look at your application’s logs and stack traces to see what the error is. You find out you’re having an issue writing to your database due a spike in traffic and throttling from your Table.
You’ve now identified the root cause and take actions to fix it. After adjusting the throttling limits – your metrics return back to normal levels.
In this example, we used metrics and alarms to notify us of a system issue. We used our dashboard to drill down and identify likely reasons the error was occuring. We used logging to figure out why the issue was occuring. And finally, we applied a fix to return our system back to a normal state. A job well done.
By having proactive alarms, good visibility into your system, and the right level of logging and traceability, you can drastically reduce the time to identify and fix issues.
To get started creating a dashboard on AWS and improving visibility into your system, check out these videos on the left and right.


